April 2, 2020
The First Real Look At COVID-19 Spread Across T&T
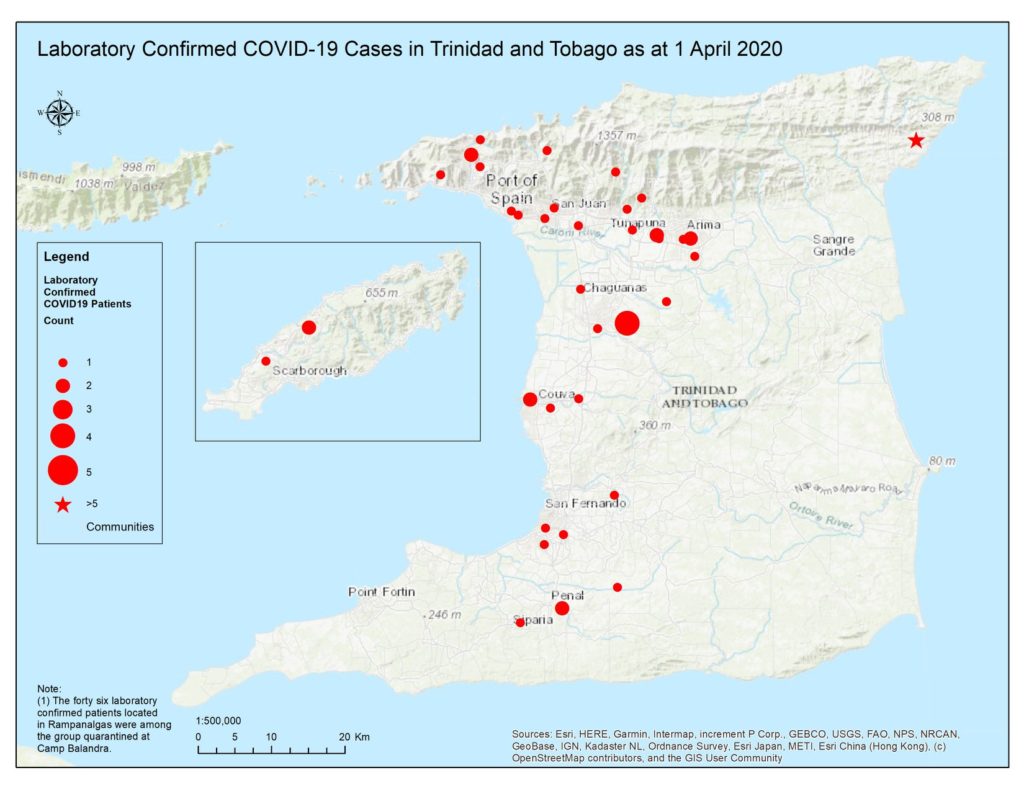
“The Geographic Information System (GIS) is being used to provide an evidence based platform for decision making. We are looking at primary, secondary and tertiary cases and learning how they are being spread and moving about. In this map (see photo above) with the lab confirmed cases the size of the red circle actually gives an indication of the actual number of cases in those areas. So if we start with Tobago we see that Tobago has two cases as shown on the map. And, if you move across to Trinidad, there is a cluster along the East West corridor that moves further along into the Caroni area towards Couva and Chaguanas. Then it goes along the Western borders though Penal and Siparia, passing through San Fernando. There is a star on the right that represents a cluster of cases that came straight off the airplane and went to Balandra- so there is no further spread from that jurisdiction. Some of those cases have moved to both Couva and Caura”. (Chief Medical Officer Dr Roshan Parasram).
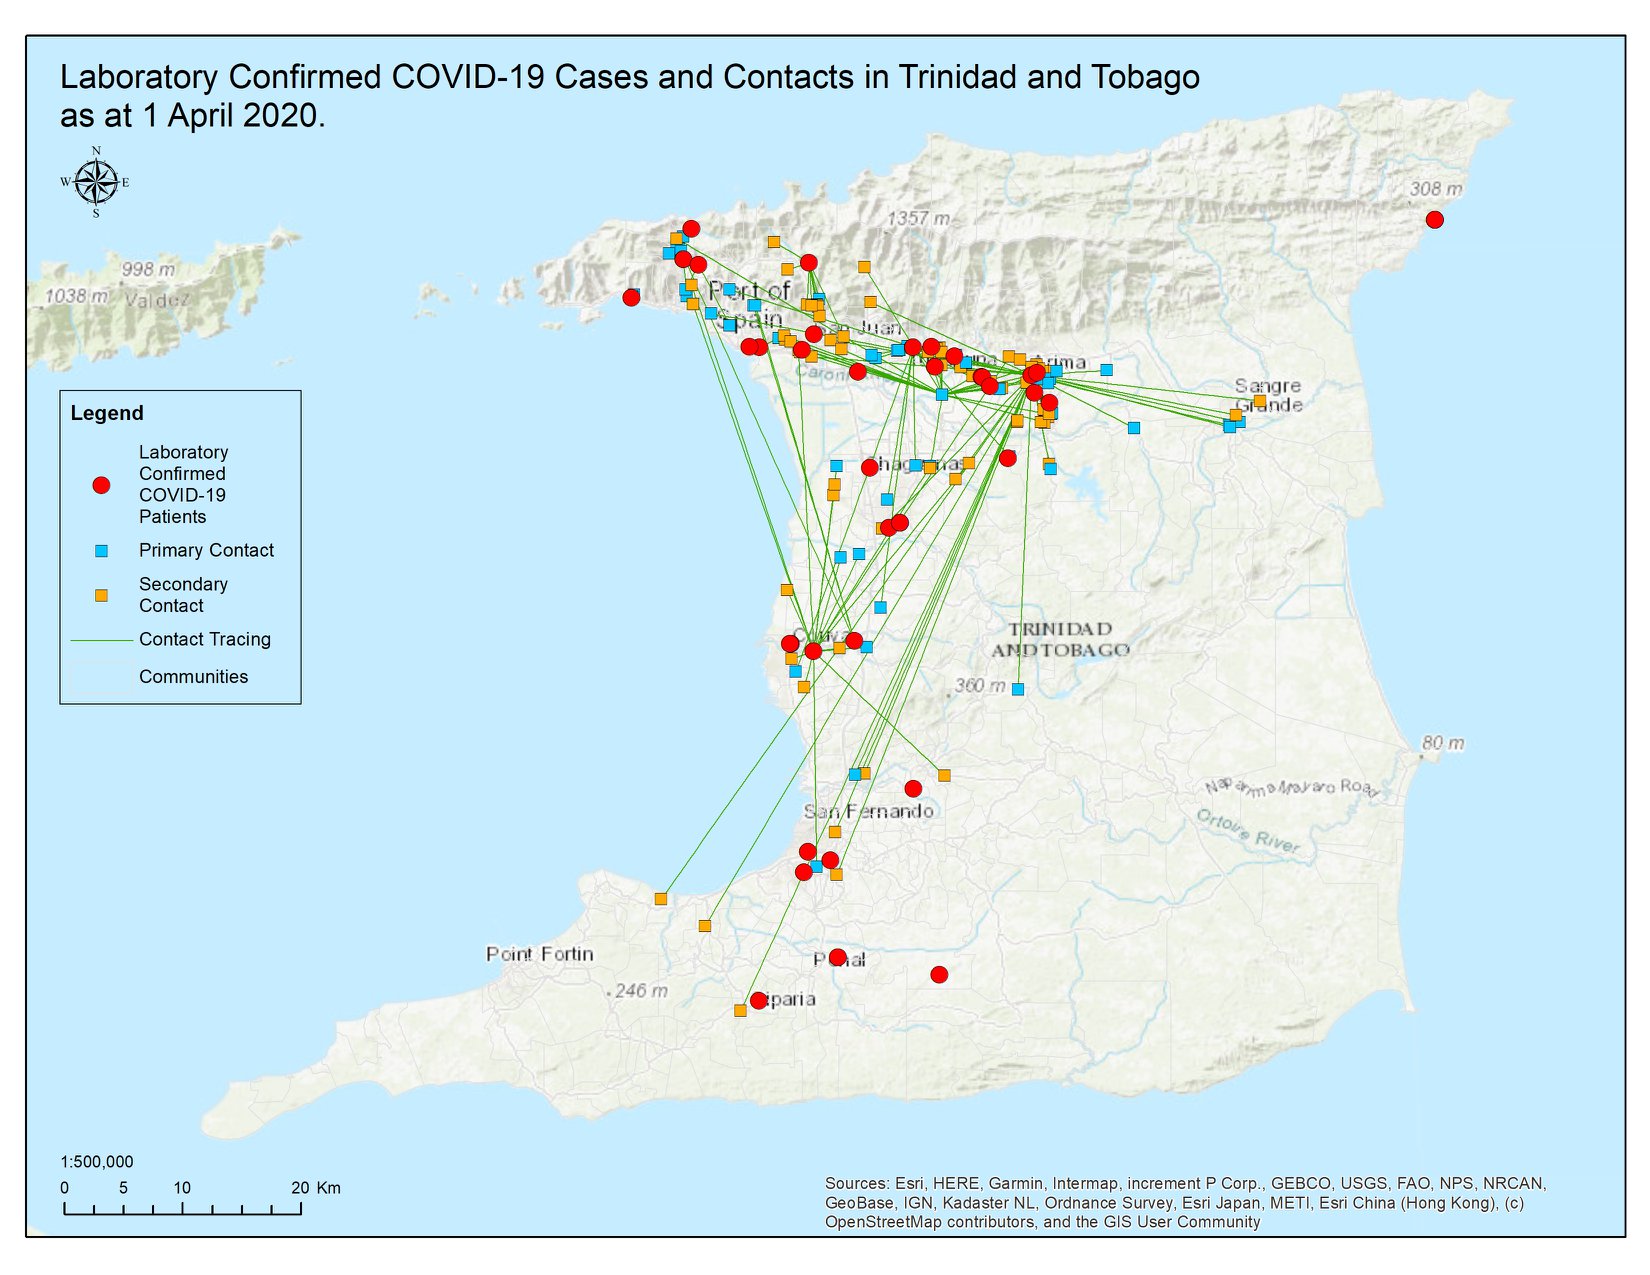
The Map Below : “This is an indication of how cases have moved. It does not map all 90 cases this is just an example, it gives movement for ten of the 90. The blue dots are secondary cases or potential secondary contacts. The other dots are tertiary. It gives you some idea of the movement across the country. You can see a primary case from the northwest of the country moving all the way down South. There is no limit to the movement anyone can have. We are seeing a dearth of cases in the SE and the NE- anyone of those cases could have moved into an area where there is not a case and there is where hidden contacts are possible. The people in the unaffected areas f the ap should not be complacent.”